RIA / Wealth-Management Practice Acquisition & SBA Underwriting Model
Buying a wealth-management book? This lender-ready Excel prices it on cash flow, not the broker's 2.2x-revenue sheet — AUM roll-forward, retention/transition, market-drawdown down-case, SBA…
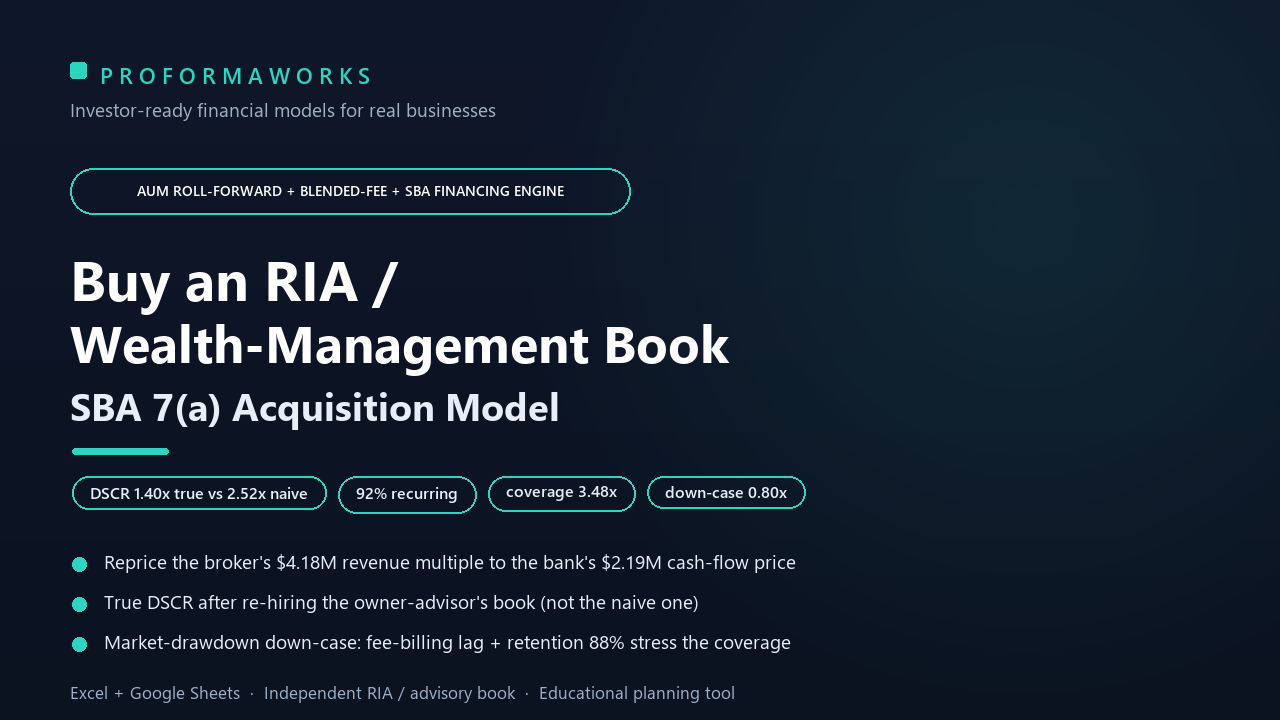
The broker prices the book at 2.2x recurring revenue. The bank prices it at ~6x cash flow. This model shows you the gap — before you overpay ~$2,000,000.
A retiring advisor's $200M book looks like a $4.18M asset on a revenue multiple. Underwritten as an SBA 7(a) acquisition — after a real advisor to replace the owner's production, after the market can move the fees, after transition attrition — it pencils at $2.19M (6.0x Adjusted EBITDA). That $1.99M gap is the whole game.
This is the model a solo/junior buyer (or an aggregator add-on) hands the lender.
What it does - AUM Roll-Forward + Blended-Fee Engine — AUM $200M × graduated fee (~0.95% blended) → recurring advisory revenue, plus planning/retainer and any transactional. Recurring share 92%. - Two prices, side by side — Revenue-Multiple Price ($4.18M, the broker headline) vs Cash-Flow Price ($2.19M, what clears the bank), with the DSCR at each. Overpay avoided: ~$2.0M. - DSCR true vs naive — 1.40x on the cash flow a lender actually accepts (after replacing the owner-advisor's production, ~$275k) vs 2.52x the broker-style number. The gap is the tell. - Market-drawdown down-case — fees are AUM-linked: a −20% drawdown (with fee-billing-lag dampener) plus transition attrition drives DSCR to 0.80x, below the 1.25x floor. The asset-class's real risk, modeled. - Retention & transition roll-forward — 90–95% if handled, 78–82% on a botched custodian switch; earnout to a 95%-at-month-24 benchmark. - SBA 7(a) capital stack — buyer equity + seller note (full-standby vs amortizing toggle as a DSCR lever) + loan sized to DSCR. Leverage lands at ~66% — honest: a wealth book is goodwill/collateral-light, so the lender sizes to cash flow, not LTV. - 3 profiles — Transactional & Hybrid-Heavy (5.0x), Balanced Fee-Based (6.0x), Fee-Only Recurring-Forward (7.0x).
What's inside - Excel model, 11 tabs, 5-year, every assumption editable and highlighted (Google-Sheets compatible — no macros) - 24-page PDF guide (how to drive it, what each number means, sources) - Recurring-fee coverage, debt yield, CoC, MOIC (leverage-amplified — flagged; no live IRR by design)
Honest by design. SDE ~31% and AdjEBITDA ~18% are real, not inflated. Benchmarks from Schwab/Fidelity RIA studies, Kitces fee data, FP Transitions/DeVoe multiples, Live Oak SBA lending. Educational planning tool — not investment or financial advice.