Farm / Ranch Acquisition & Lender Underwriting Model
Every farm template on the market is a ten-year forecast for someone who is STARTING a farm.
Every farm template on the market is a ten-year forecast for someone who is STARTING a farm. This one underwrites the purchase of a farm that already exists, the way the lender will.
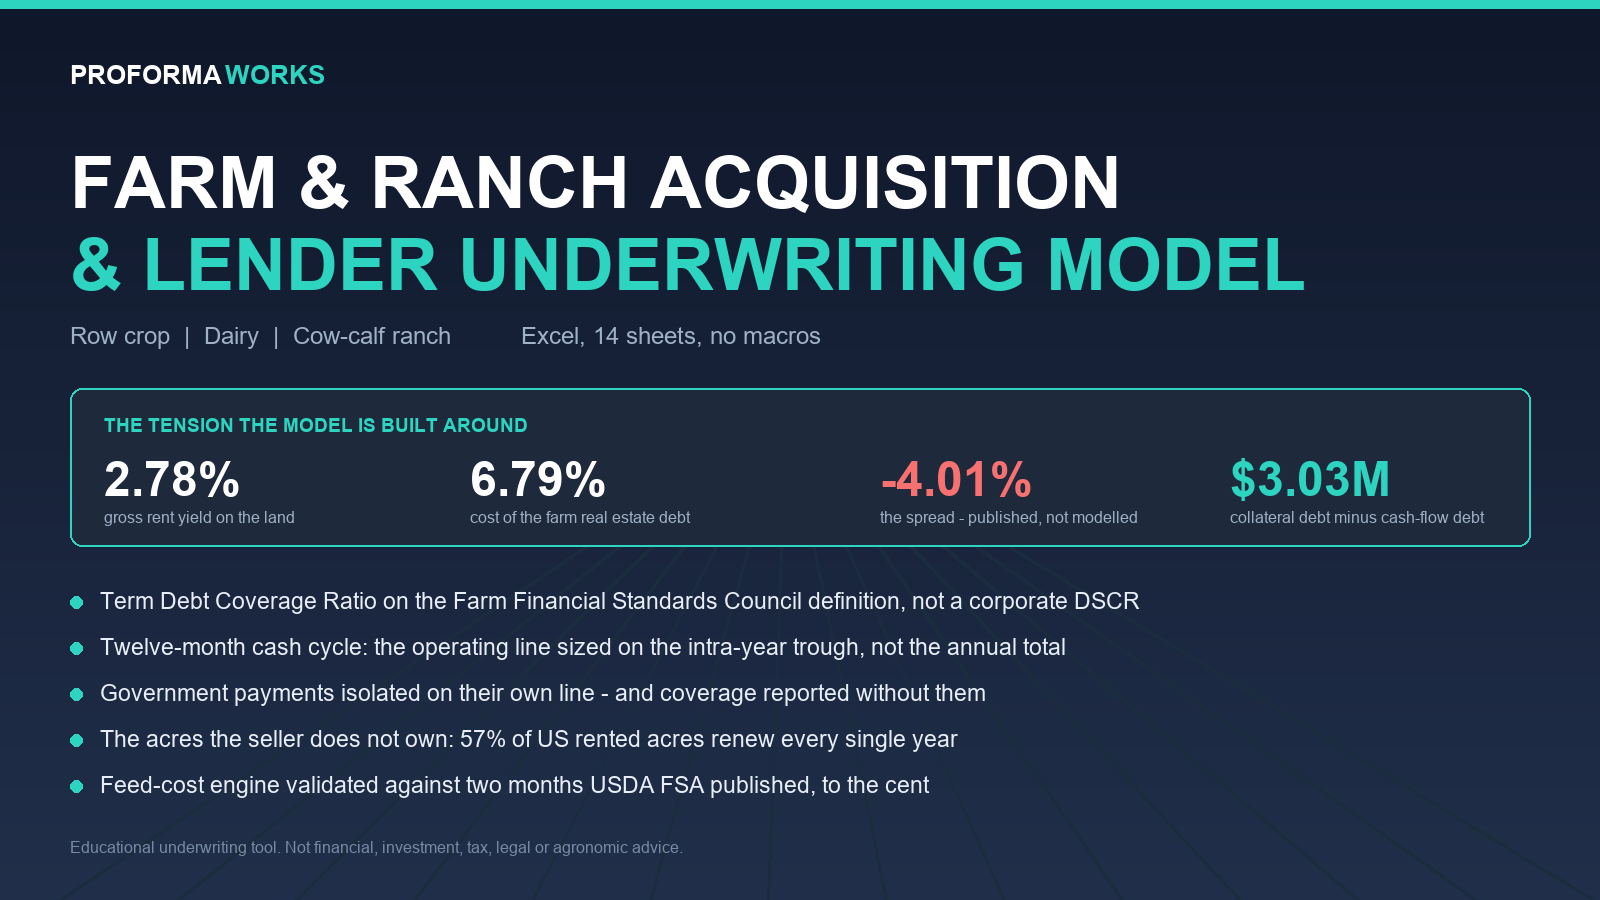
It is built around two published numbers. United States cropland rented for $161 an acre in 2025 against a cropland value of $5,830 an acre — a gross rent yield of 2.76% (USDA NASS). The average interest rate on farm real estate loans in 2026:Q2 was 6.79% (Federal Reserve Bank of Chicago, AgLetter No. 2013, 79 responding banks). The current income of the asset sits roughly four hundred basis points below the cost of the debt that finances it. Two numbers, two agencies, no opinion in between — and the consequence is structural: a farm deal can carry an enormous balance sheet and negative cash flow at the same time, which a revenue forecast cannot show because it has no balance sheet with land in it.
So the model prints two ceilings on the same purchase. What the COLLATERAL supports, capped at the 85% loan-to-value limit of 12 CFR 614.4200. And what the CASH FLOW services, built from the Farm Financial Standards Council's capital debt repayment capacity at your target coverage. The gap between them, in dollars, is the Land Paradox Bridge — and it tells you whether the deal is being carried by the farm, by your equity, or by an expectation of appreciation.
Three things it does that a farm budget does not. It uses the TERM DEBT COVERAGE RATIO, whose numerator adds off-farm income and subtracts family living withdrawals and taxes, and prints the corporate DSCR beside it so you can read the size of the overstatement. It builds twelve months of cash and sizes the operating line on the intra-year trough, because 7 CFR 762.125 requires the lender to model the operating cycle, not the calendar year. And it separates the acres the seller does not own: 39.3% of US farmland is rented and 57% of rented acres renew every year, so it prices what a failed renewal does to coverage.
Government payments sit on their own line, and coverage is reported without them — they were 28.9% of US net farm income in the 2026 forecast against 7.9% in 2024.
Three subtypes on one switch: row crop, dairy, cow-calf ranch. The dairy feed-cost engine reproduces two months of USDA FSA published Dairy Margin Coverage values to the cent, on a sheet you can check. Fourteen sheets, no macros, Excel and Google Sheets, and a Limitations sheet that lists what the model refuses to guess — including the farmland cap rate, because none is published.