Self-Storage Acquisition & Underwriting Financial Model
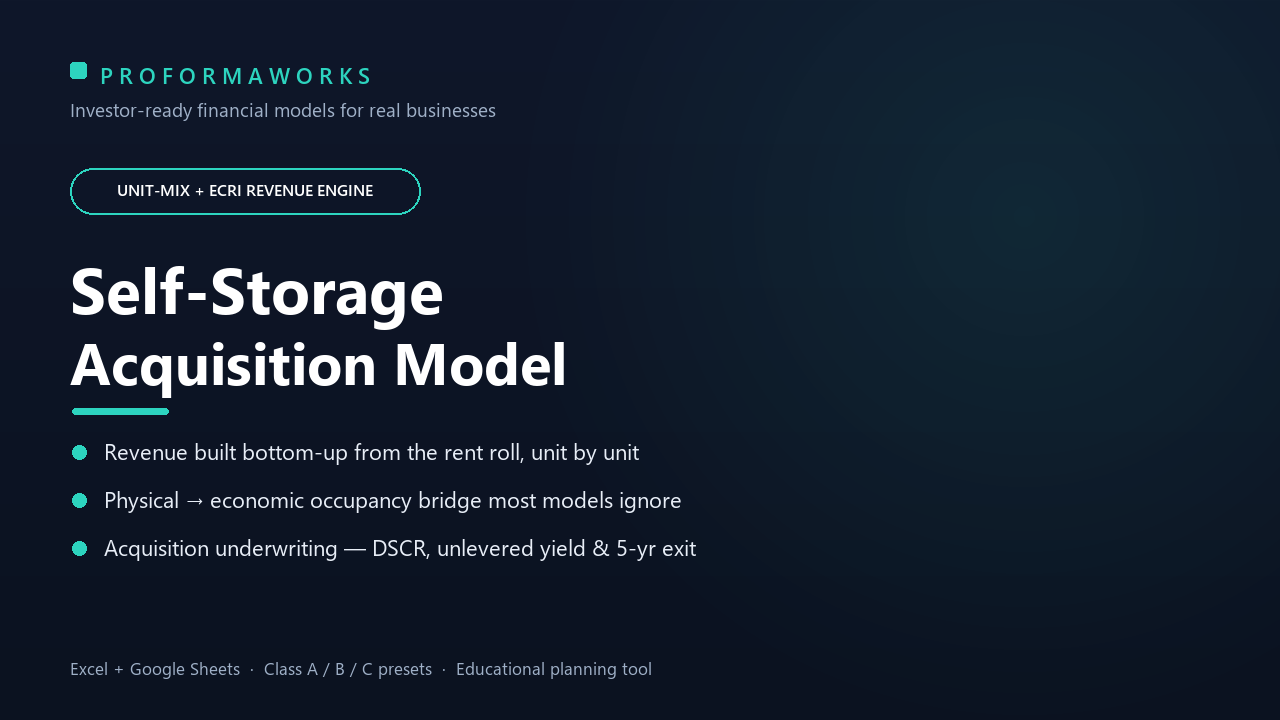
The only single-facility self-storage model built from the rent roll up — GPR via SUMPRODUCT across six unit sizes, the physical→economic occupancy bridge most templates skip, ECRI…
Buying a single self-storage facility — and need to know whether the deal actually covers its debt? Every other storage template makes you type one blended rent per square foot and books revenue on physical occupancy, double-counting income you never collect. A storage deal lives or dies on its rent roll and what you actually bank. So this model builds your revenue from the unit mix up.
Gross potential rent is built bottom-up — SUMPRODUCT(unit counts, street rates) across six unit sizes — so net rentable square feet, total units and the headline rent/sf all fall out of the same rent roll. Then it runs the one bridge almost every template skips: physical occupancy to economic occupancy (physical − concession gap − delinquency gap), and books revenue on what you actually collect. Same-store growth comes from ECRI — the existing-customer rate increase, net of induced vacate — the way the public REITs really raise rent. Then it underwrites the purchase like an acquisition: price from in-place NOI and the going-in cap, capital stack, DSCR, the unlevered yield, payback and a 5-year exit.
What it builds for your deal:
- Unit-Mix Revenue Engine — GPR = SUMPRODUCT(unit counts, street rates) across six sizes (5×5 locker through 10×20 and climate-controlled). NRSF and total units are derived from the same rent roll, so rent/sf is never guessed. The default settles at 475 units, 45,750 NRSF and $709,800 of annual GPR.
- Physical → economic occupancy bridge — economic occupancy = physical − concession gap − delinquency gap, and revenue is booked on the economic figure (87% at the default, not the 90% physical). The most common way storage pro formas overstate income, fixed.
- ECRI growth, with a source — same-store growth is the existing-customer rate increase net of induced vacate (NetECRI = ECRI × (1 − vacate)), not a flat percentage invented to make Year 5 look good.
- 3-facility-class toggle — one switch reloads the whole economics (rate factor, occupancy, cap rate, ancillary income, ECRI) from an editable preset table: Class A (urban/climate), Class B (suburban) and Class C (drive-up) all in one file.
- Year-1 lease-up runway — see the deal climb from going-in to stabilized occupancy month by month while the loan is due.
- 5-year P&L & NOI — NOI struck after a full operating stack (management, property tax, marketing, processing, utilities, payroll, insurance, reserves), at SITE level (explicitly not a REIT's corporate margin). The default runs $666,928 stabilized EGI at a 63.6% NOI margin.
- Full acquisition underwrite — price from in-place NOI ÷ going-in cap ($6.24M at the default 6.5% cap, $136/sf), the capital stack, DSCR 1.36x stabilized (1.24x in the lease-up year), a 6.9% unlevered yield-on-cost, a conservative 5-year exit and a 1.80x equity multiple.
What's inside:
- 10-sheet Excel workbook (works in Google Sheets too — no macros, no add-ins, no external links)
- 18-page PDF user guide — quick start, sheet-by-sheet walkthrough, how the unit-mix engine and the occupancy bridge build your revenue, how a lender reads your DSCR and unlevered yield, where to find the seller's real numbers, and a full FAQ
- START HERE sheet: your first underwrite in minutes, only amber cells to fill
- Unit-Mix Engine sheet — GPR built bottom-up from a six-size rent roll via SUMPRODUCT
- Setup sheet with a 3-class preset matrix you can edit to your exact facility
- Dashboard with KPI cards and a 5-year NOI trajectory, formatted to share with a lender or partner
- Benchmarks sheet with sourced 2024-26 occupancy, rent/sf, cap-rate, ECRI and DSCR ranges
Why this one: every formula is machine-verified — the full calculation graph is recomputed by three independent engines (including Excel itself) before release, and the unit-mix engine, the occupancy bridge and the class toggle are all stress-tested. Honest by design: storage in 2024-25 runs negative leverage (caps below debt rates), so the headline is the unlevered yield, DSCR and the equity multiple, not a cash-on-cash flattered or dragged by leverage. Models that balance.
Educational planning tool — not financial, legal, tax or investment advice. Storage rents, occupancy, cap rates, ECRI and property taxes vary by market and change over time; a property-tax reassessment at purchase can move NOI materially. Validate the seller's rent roll and financials, your loan terms and local market data before relying on any number.